Exposing Healthcare's Hidden Billions
Animated lead art and scrollytelling for Hunterbrook
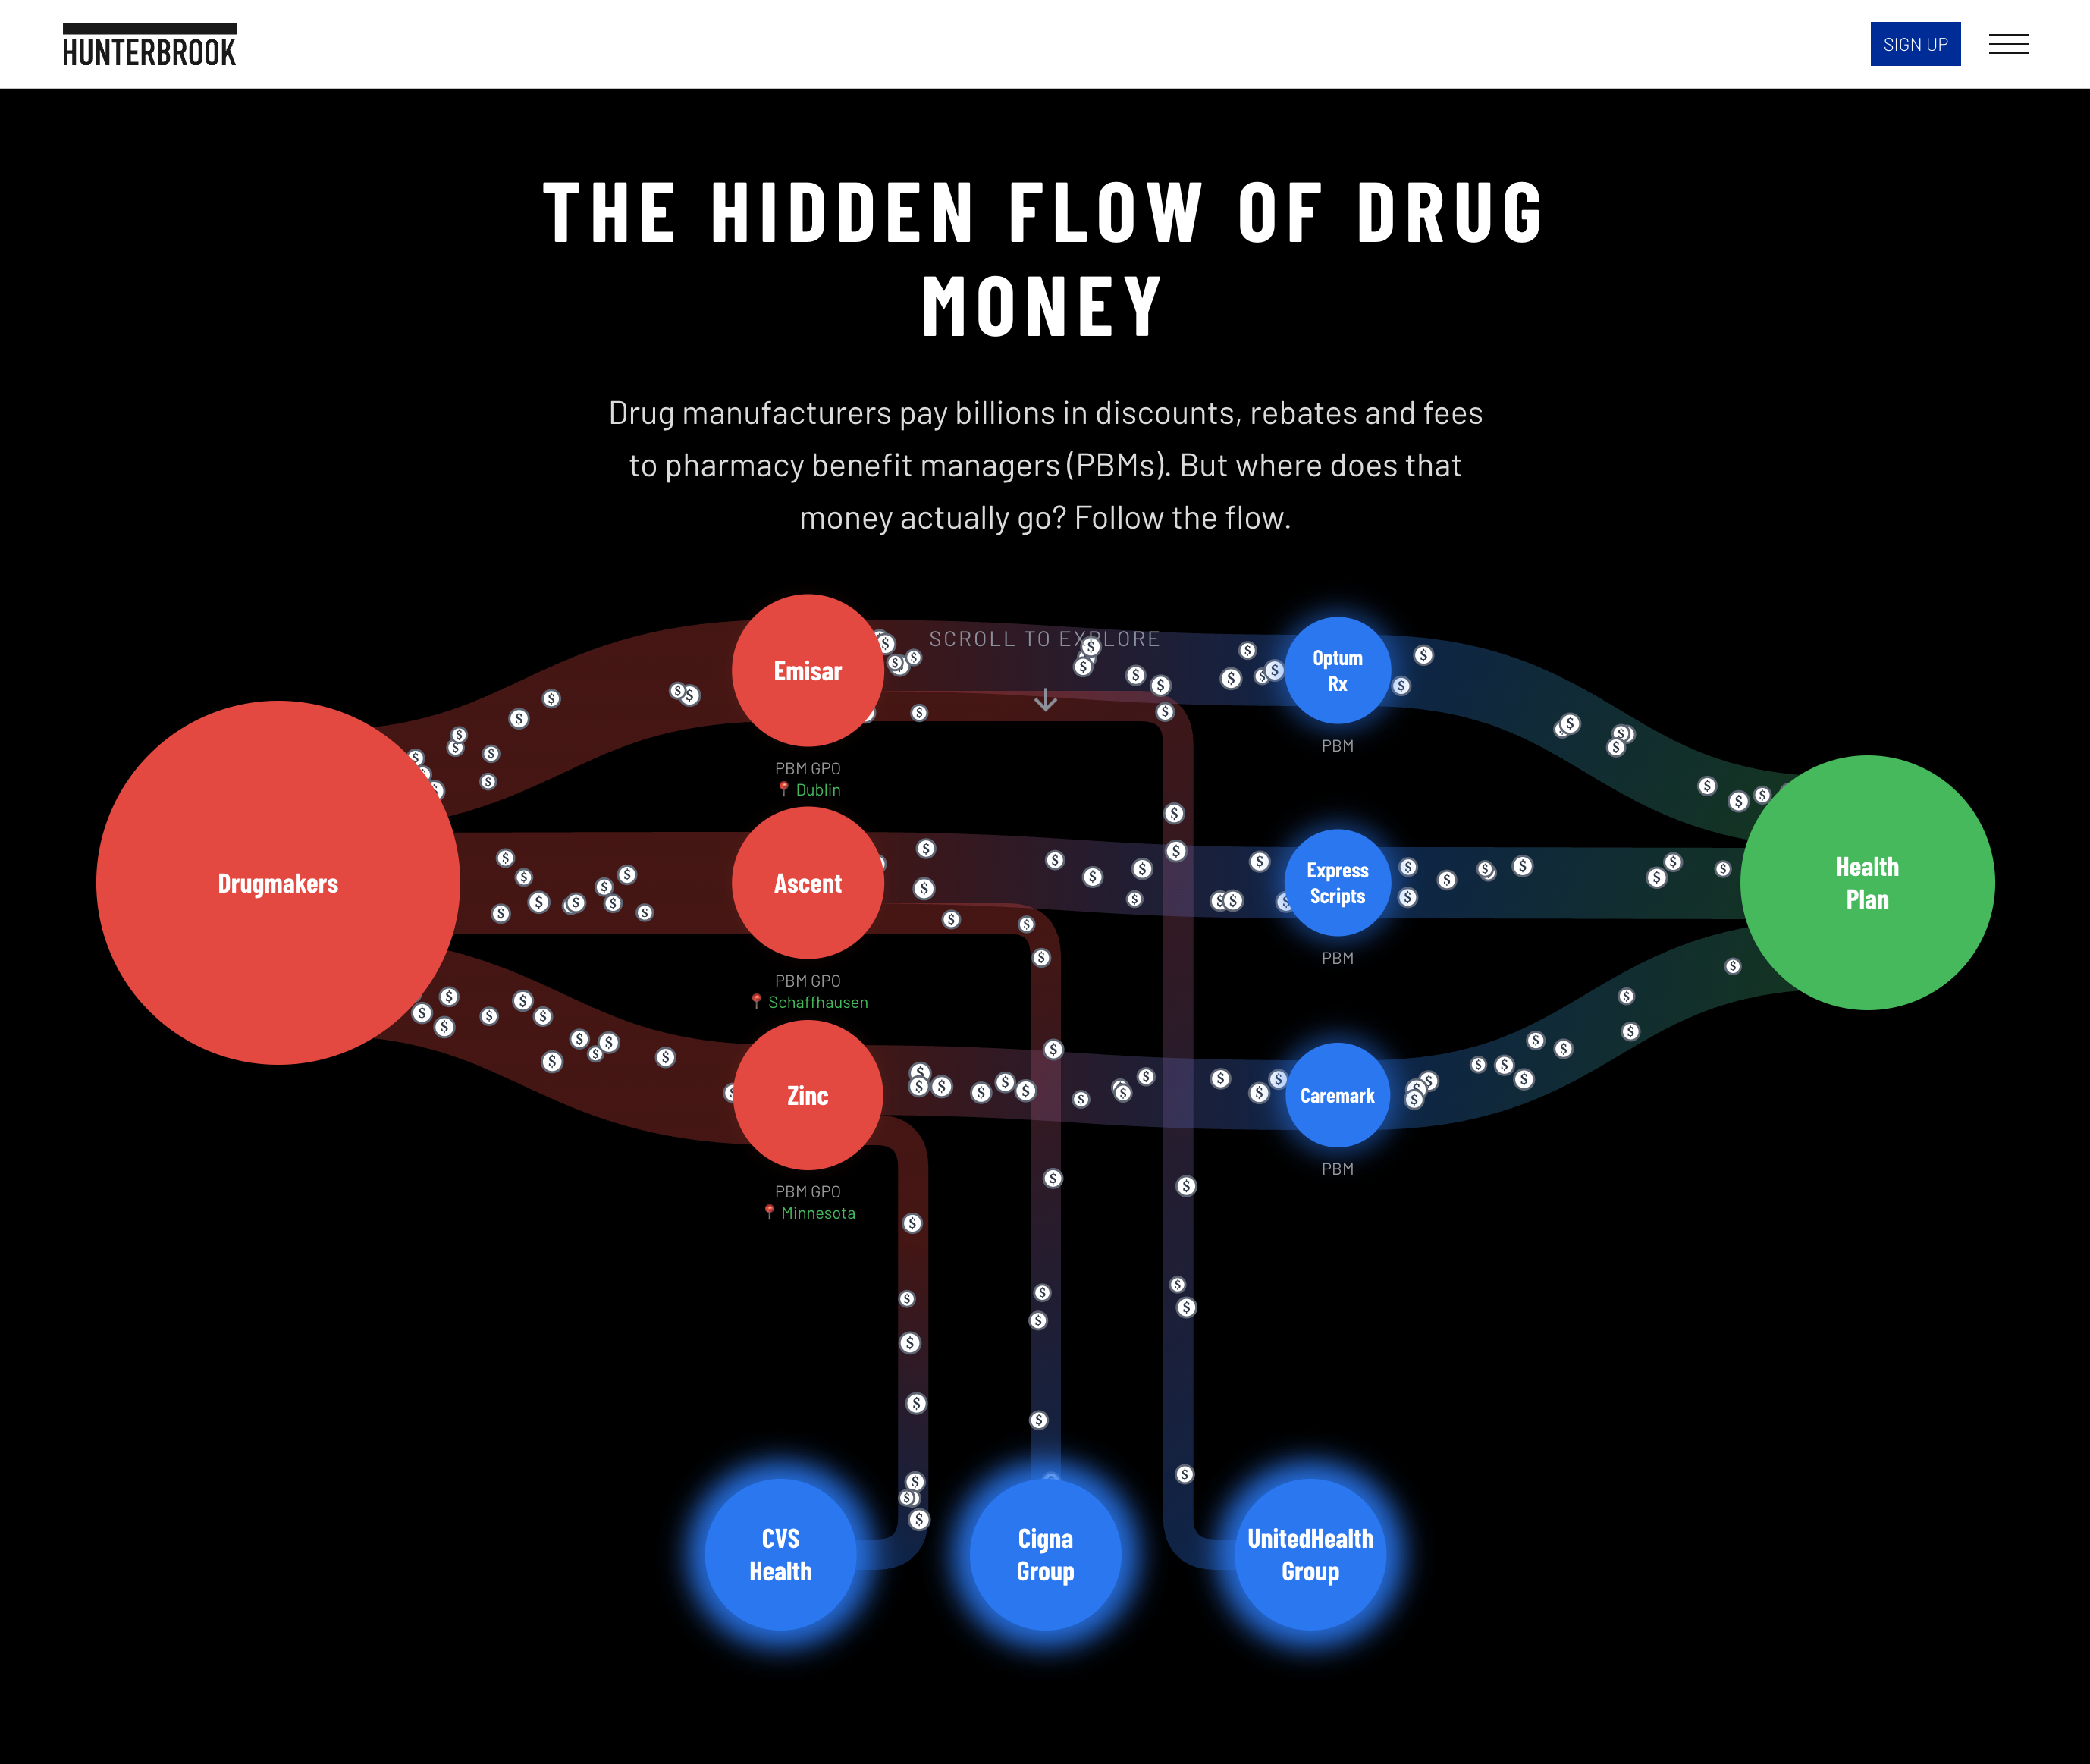
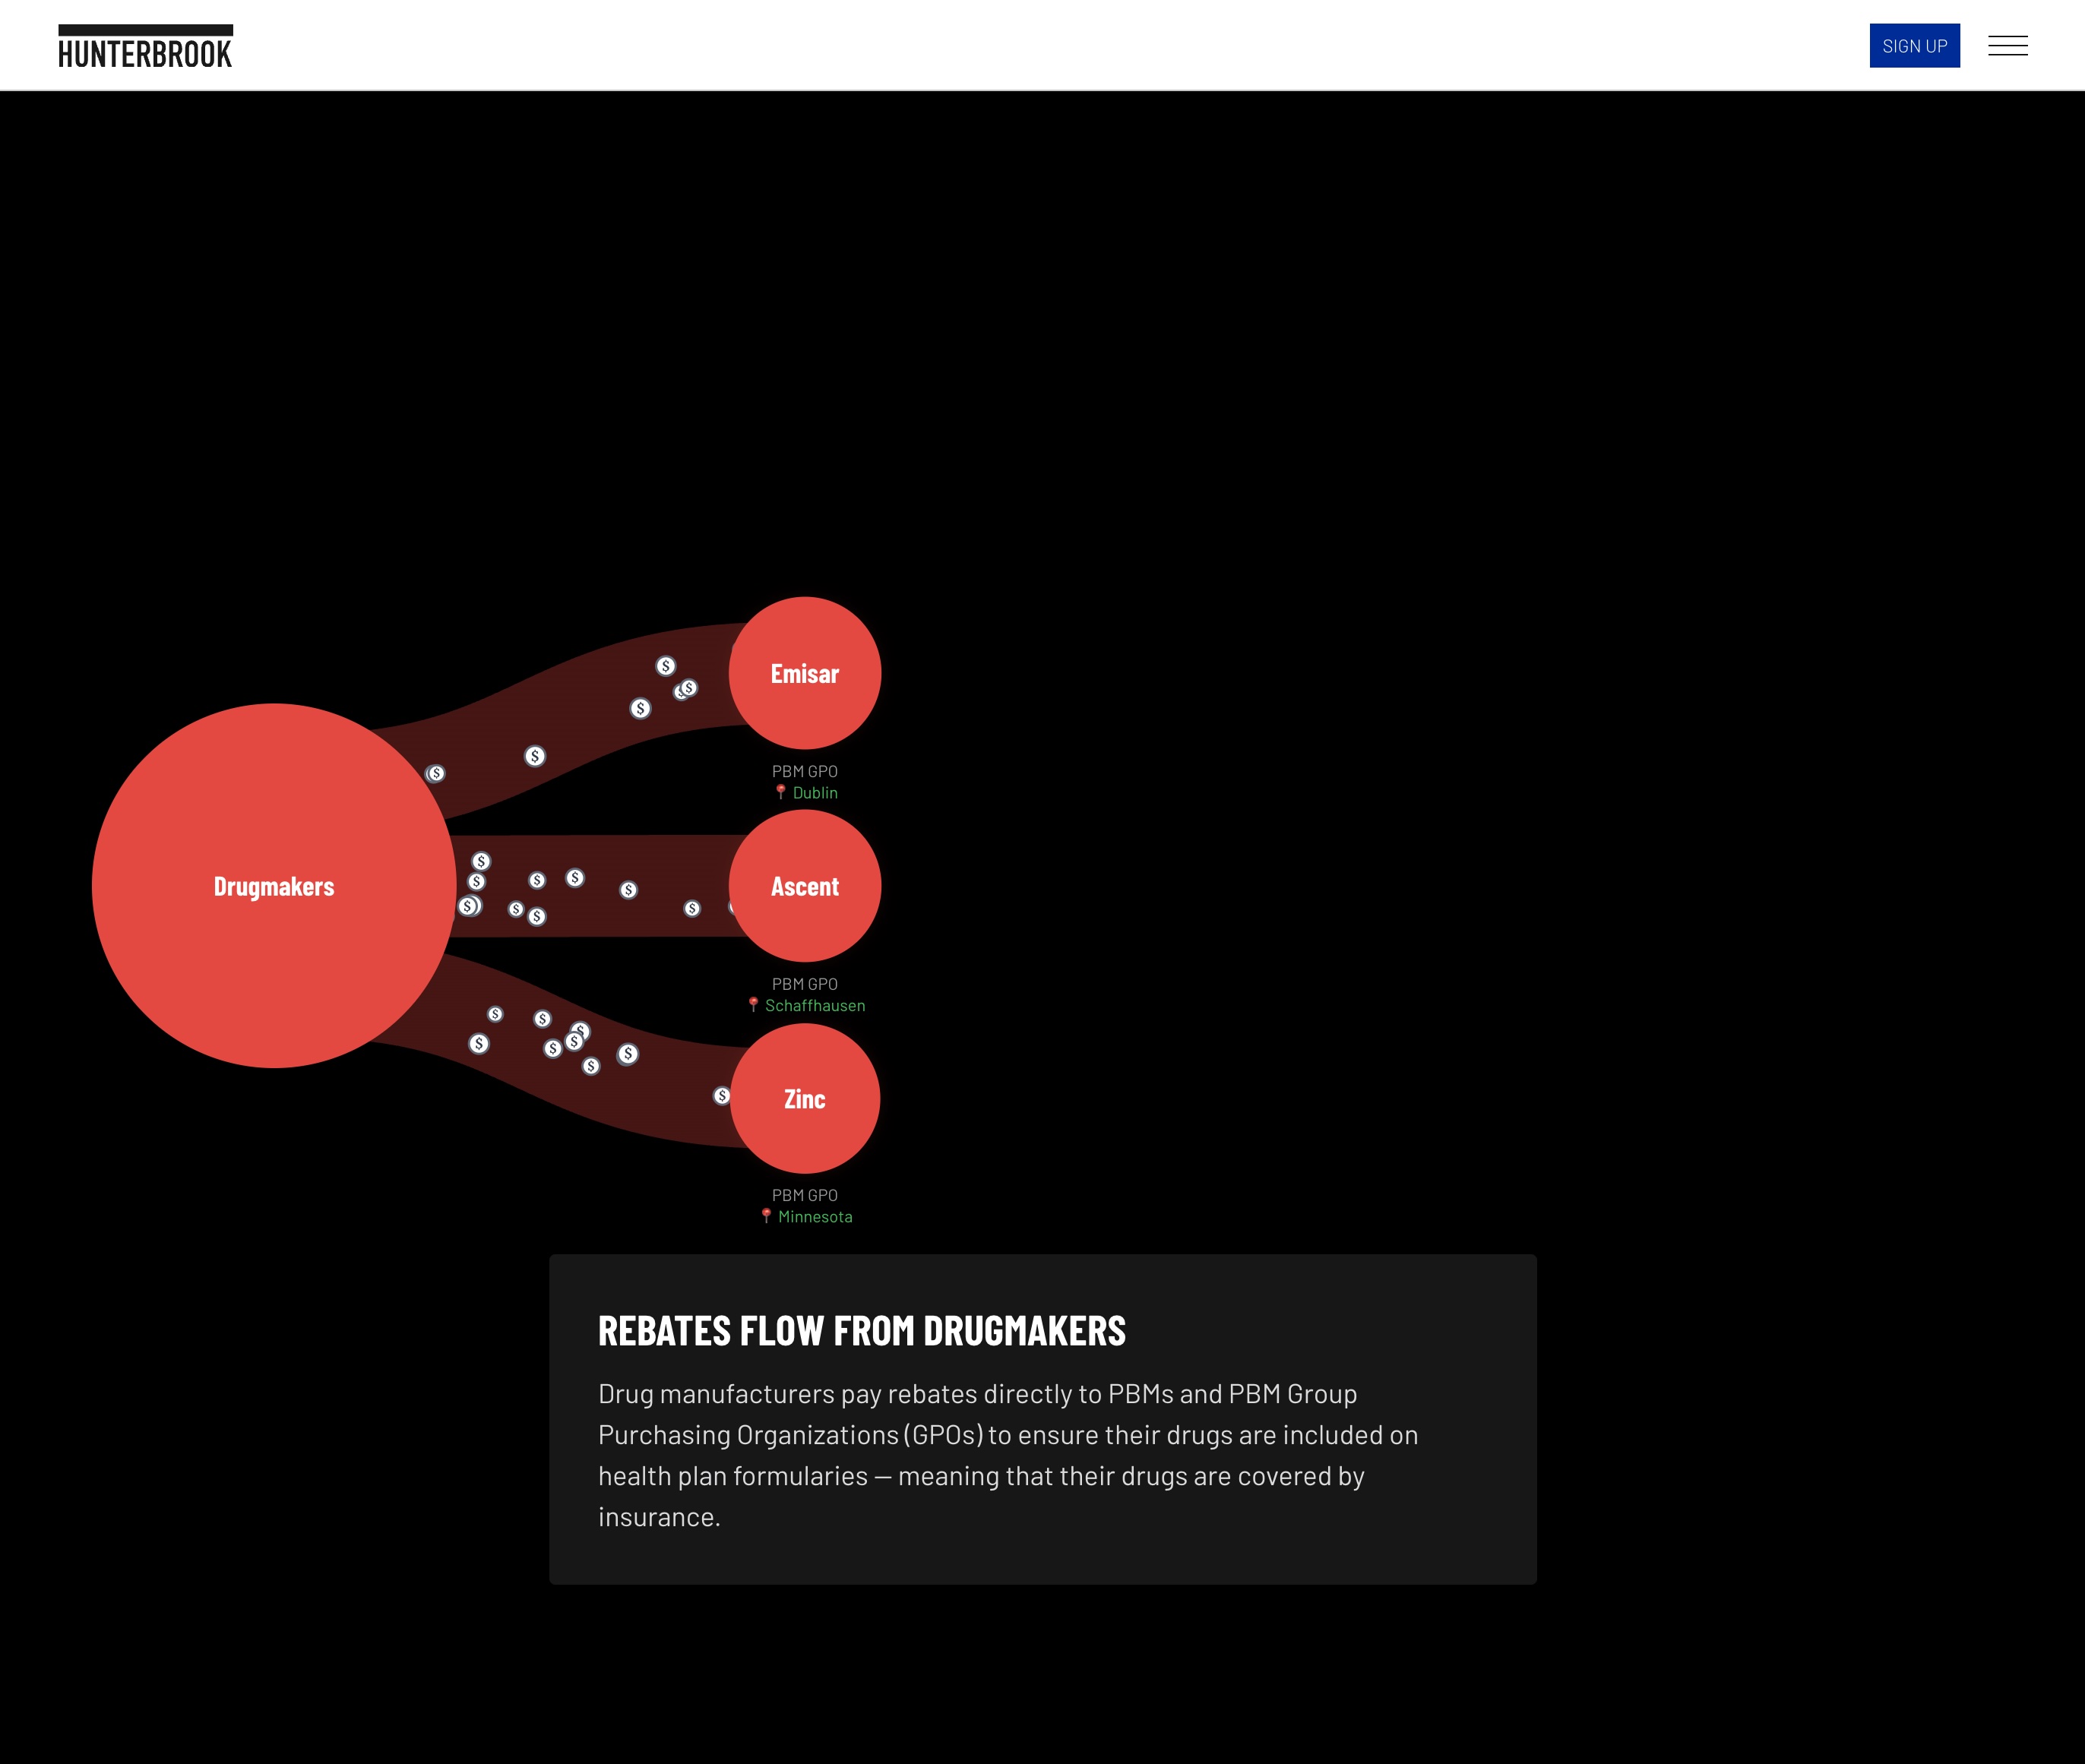
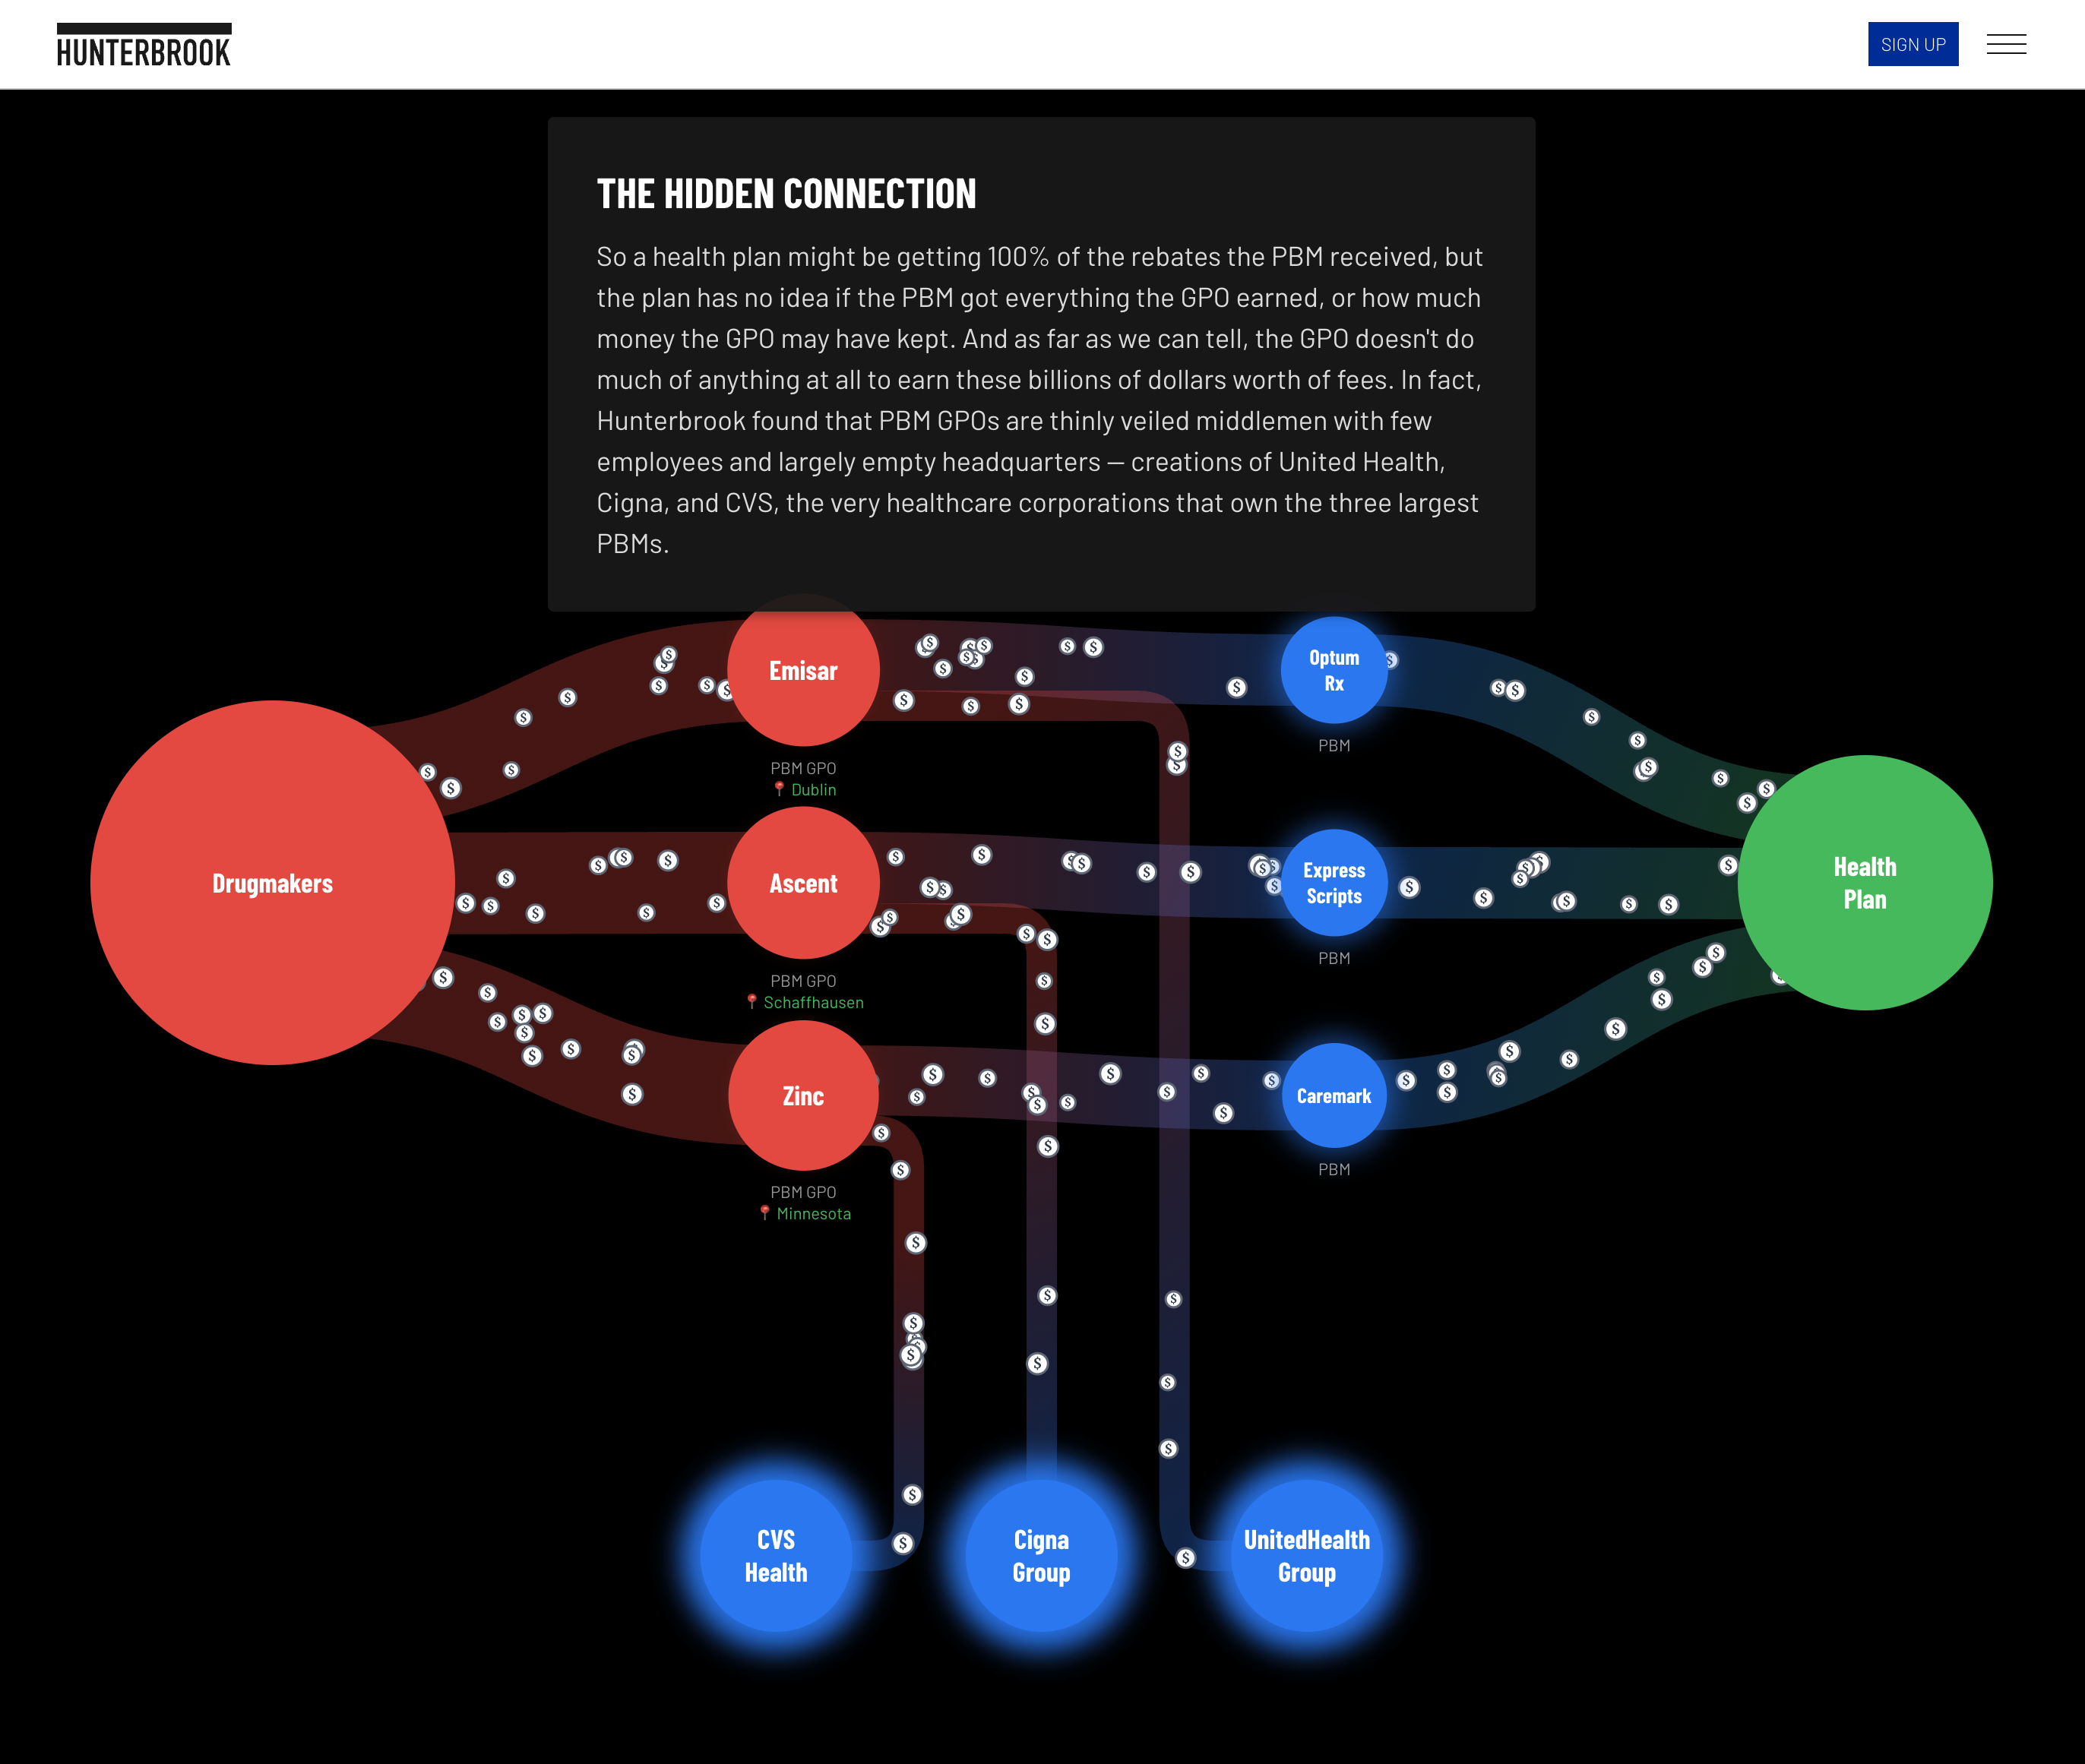
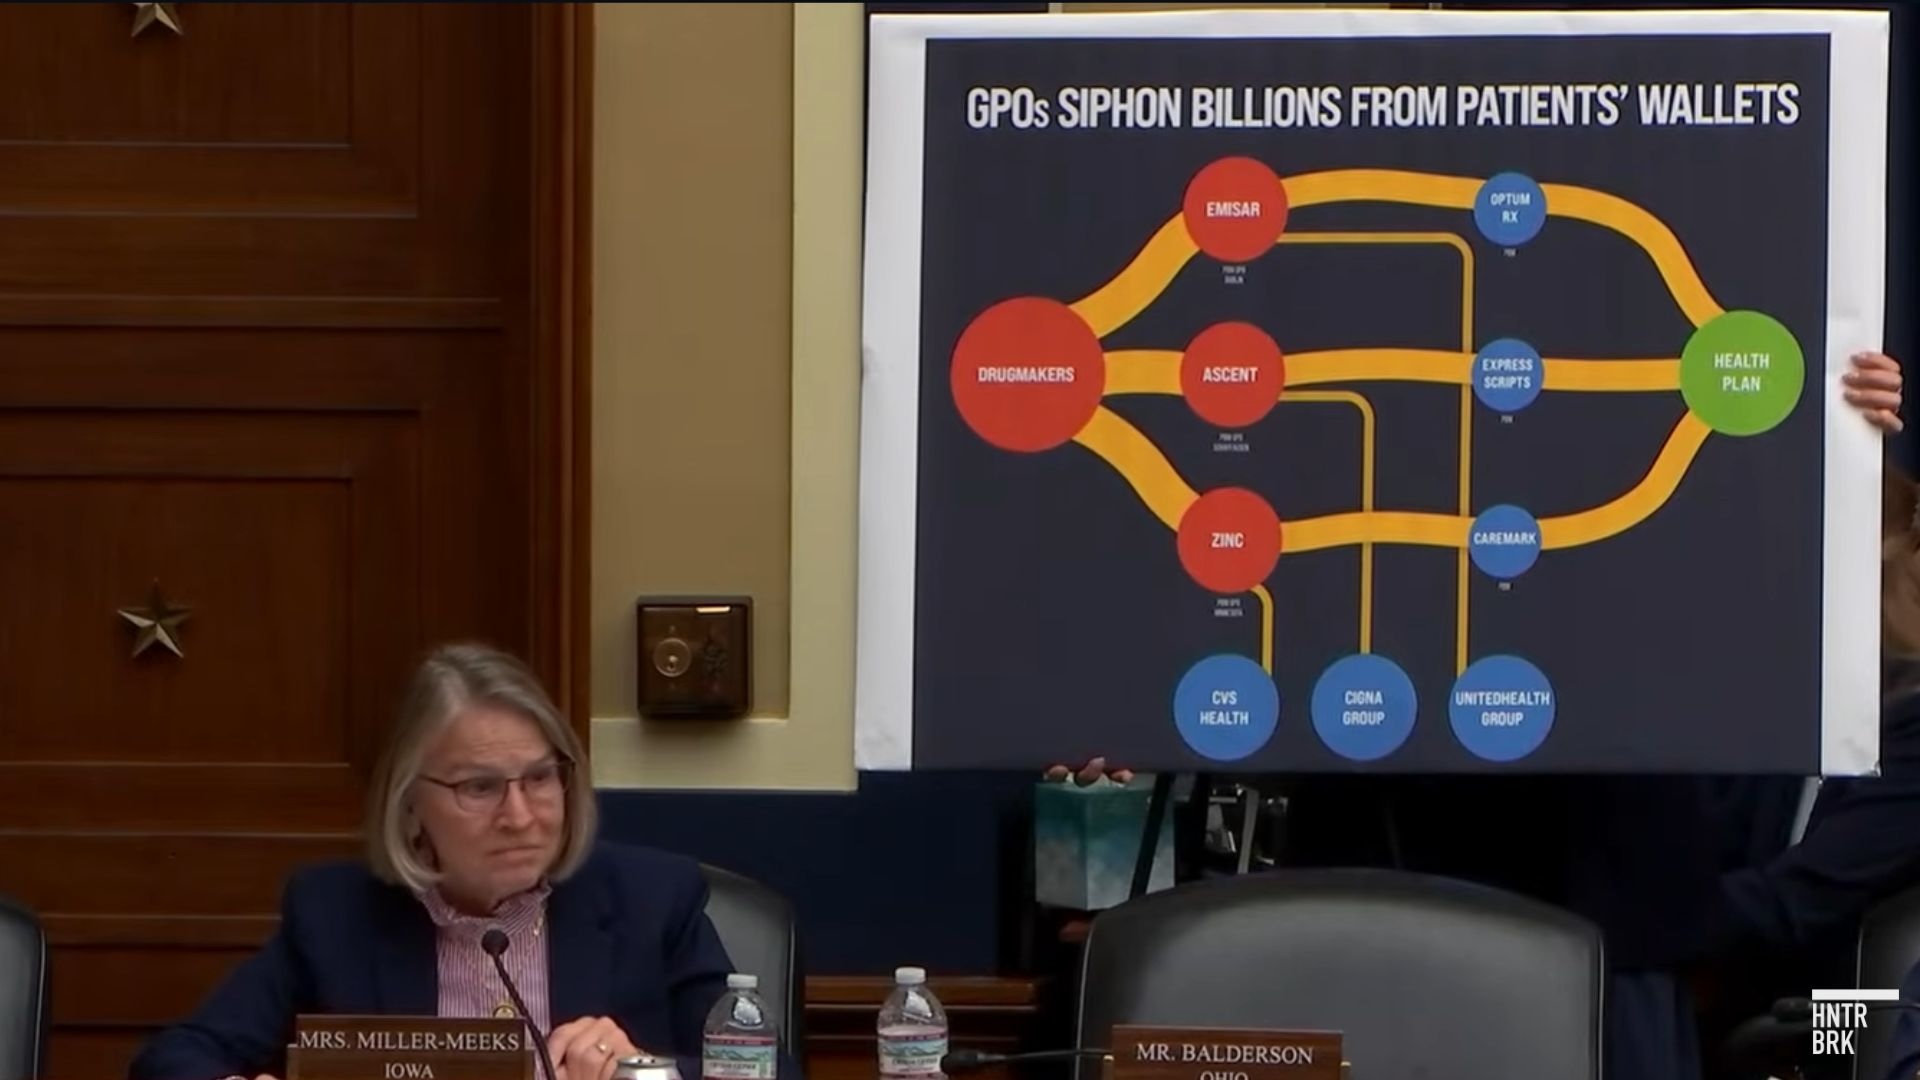
Hunterbrook Media's multinational investigation revealed how CVS, UnitedHealth, and Cigna created secretive subsidiaries—so-called PBM GPOs—to divert billions from health plans and patients. DGFX delivered the visual framework: an animated illustration for lead art, an interactive scrollytelling experience, and the corporate flowchart that made the complex financial engineering understandable.
Three weeks after publication, that flowchart appeared on the House floor. Rep. Marianette Miller-Meeks held up our graphic while questioning the CEOs of all three healthcare giants. Republicans and Democrats both cited the investigation. A congressman entered the full Hunterbrook report into the Congressional record.
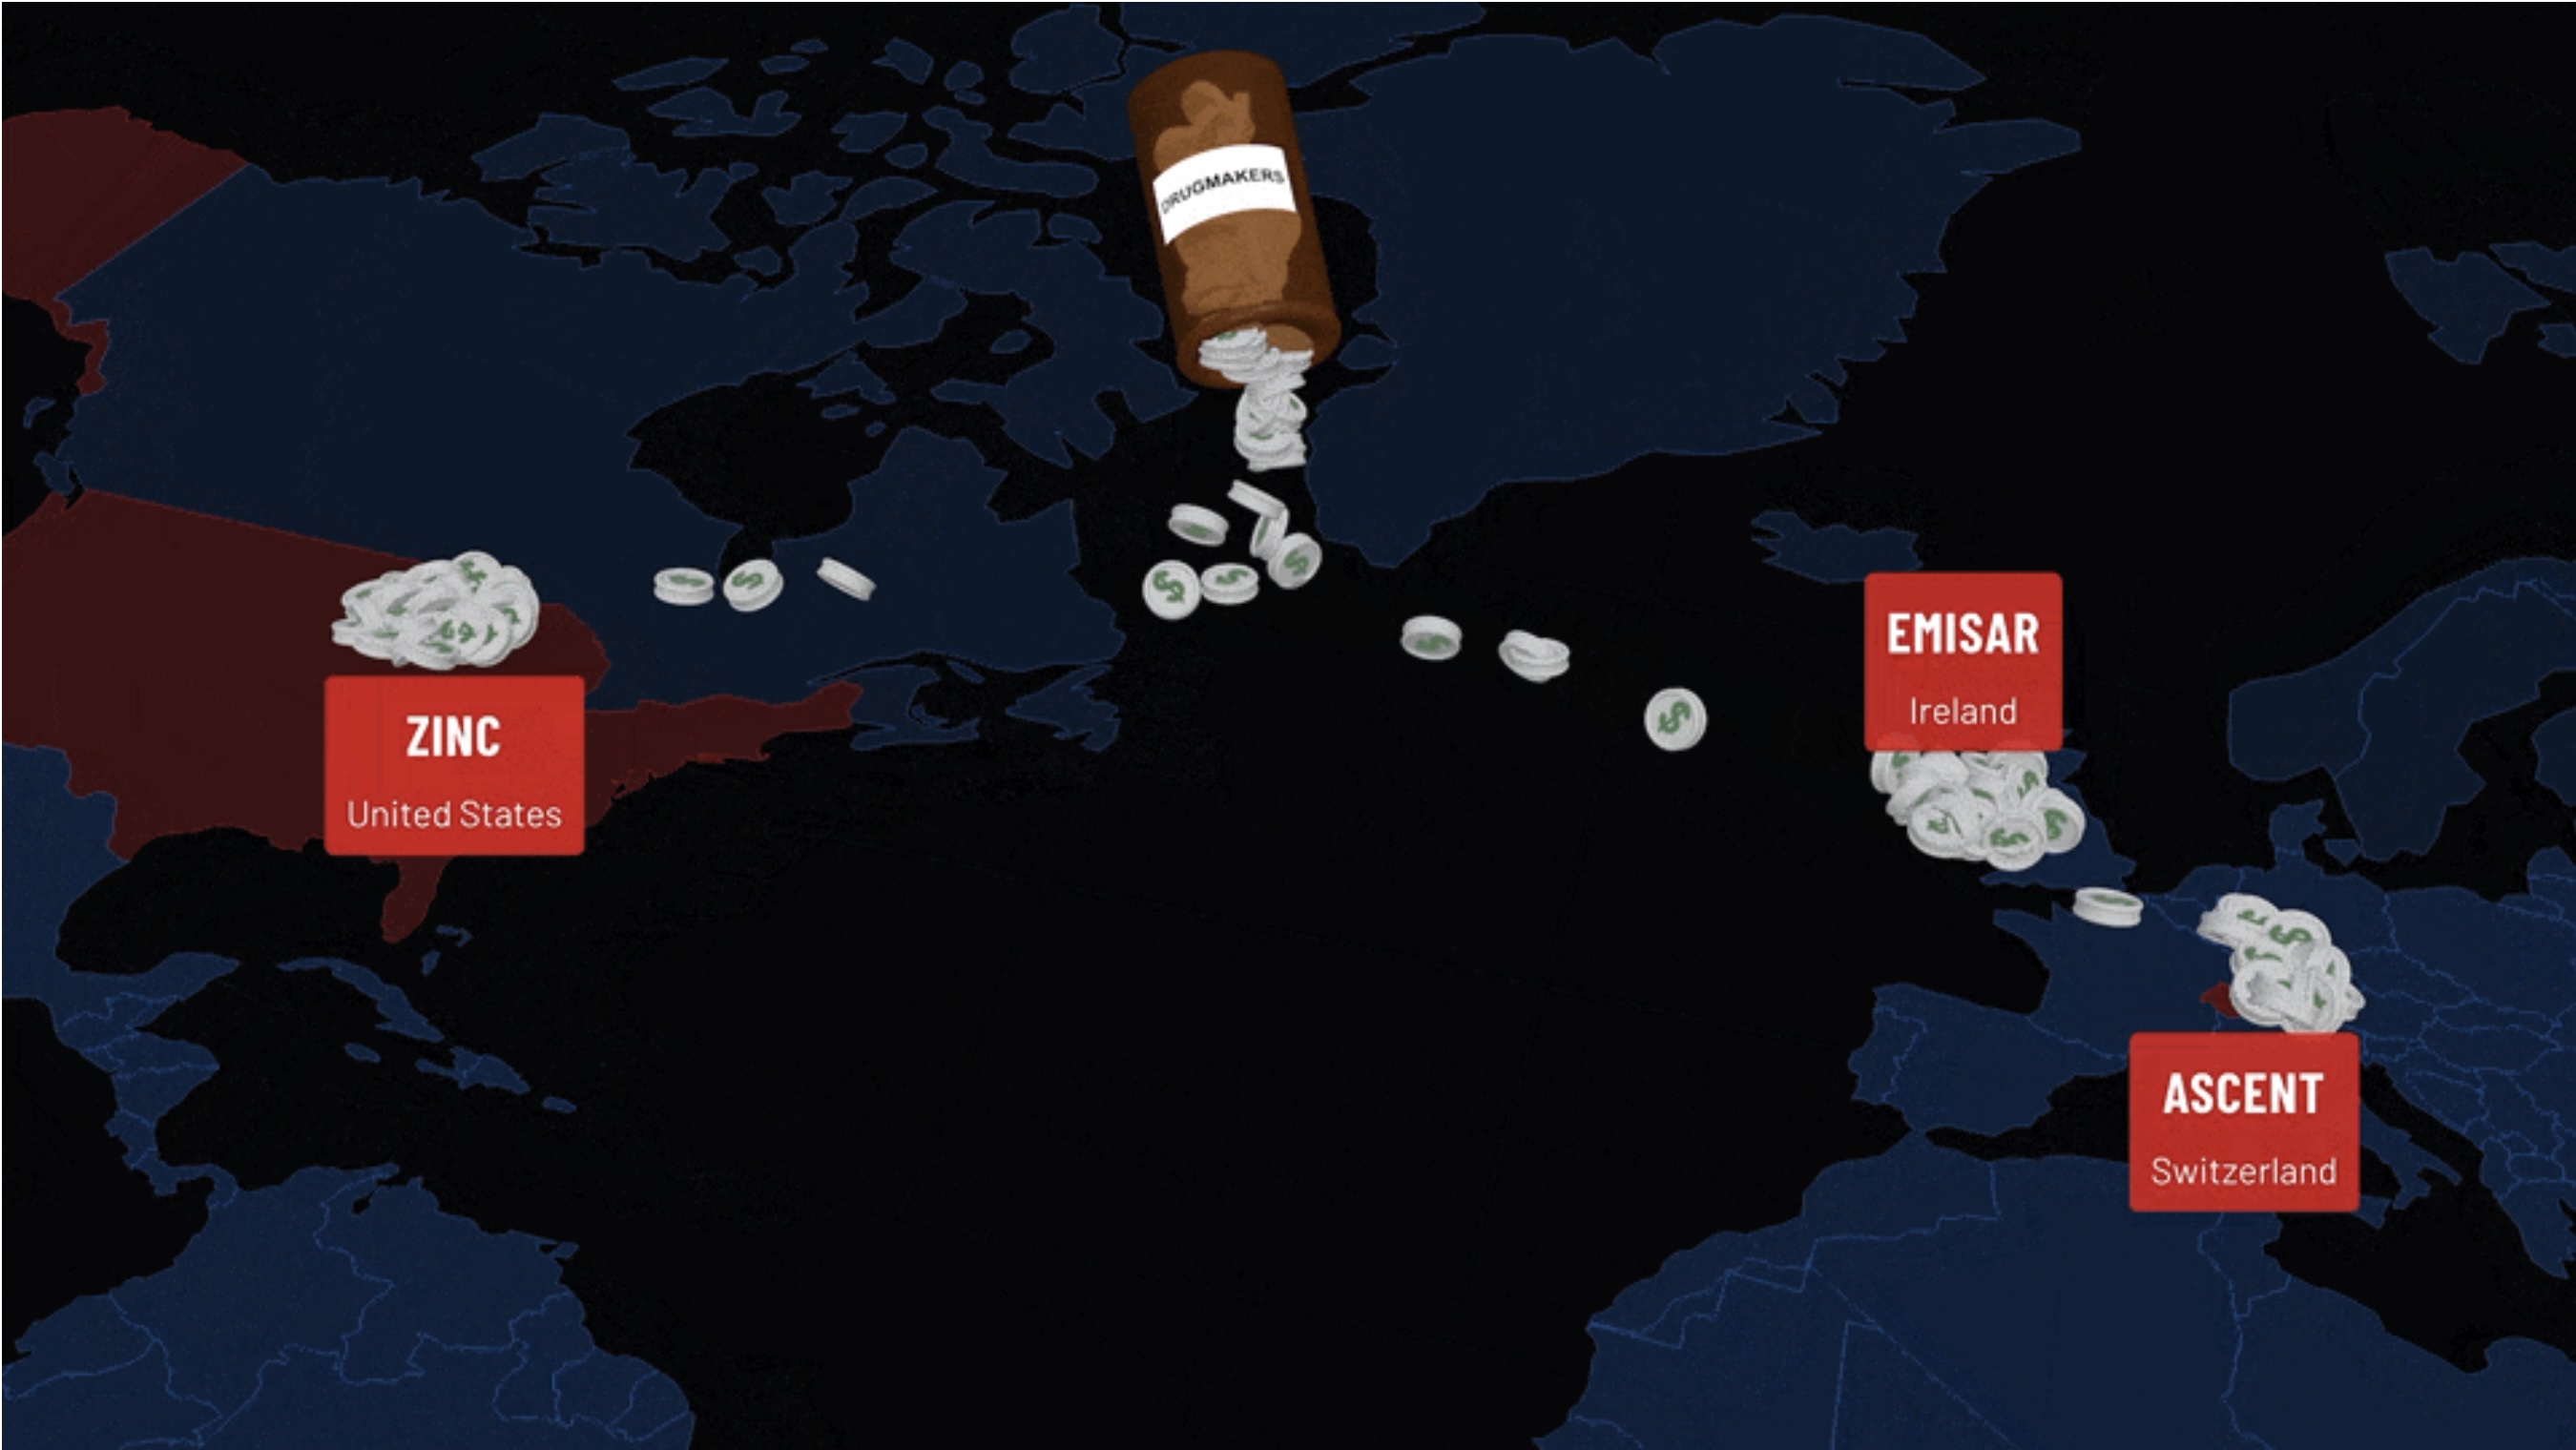
The lead animation shows pills pouring endlessly—a visual metaphor for money flowing through the healthcare system's hidden channels. The scrollytelling component guides readers through the investigation's complex findings, making the financial engineering accessible without sacrificing depth. Reporters visited ghost headquarters across Minnesota, Dublin, and Switzerland. The graphics had to match the gravity of what they found.
Above: Animated pill-pour illustration for story lead; DGFX flowchart displayed on House floor during Congressional hearing; Mobile-optimized scrollytelling experience.
Built for the scroll
Everything we build is multi-channel from the start. Horizontal, vertical, desktop, phone — it all works. But it's not just responsive web. Our pipeline outputs reels, TikTok content, video assets that video teams can cut into long-form journalism.
The scrollytelling component guides readers through the investigation's complex findings. Laura Wadsten's reporting was exhaustive — acronyms, shell companies, money flows across three countries. The concern was that it was a story only a subject matter expert could love.
So we boiled it down. Pencil and paper first. Draw the network until you understand it, then strip it to the essential nodes. Make it abundantly clear what's going on.
“We’re not doing viz for viz sake. We’re giving them a tool to change the conversation.”
From newsroom to House floor
Two weeks after publication, Rep. Marianette Miller-Meeks held up the DGFX flowchart on the House floor while questioning the CEOs of CVS, UnitedHealth, and Cigna. One of her aides had annotated it with a highlighter. Republicans and Democrats both cited the investigation. A congressman entered the full Hunterbrook report into the Congressional record.
That's about as big as it gets in terms of impact.
The network, revealed
The lead animation shows pills pouring endlessly — a visual metaphor for money flowing through healthcare's hidden channels. Built in Three.js so it could run in browser if needed, then captured as a GIF for maximum shareability. Every time someone shares the link, it's got motion. Every LinkedIn post, every embed — motion.
Hunterbrook asked for lead art. We gave them that, plus the scrollytelling component they didn't know they needed. That's another thing you get with us — an art director. You're gonna get what you want, but we're also gonna get you what you need.
Capabilities
Here is how we did it
Javascript
Scrollytelling
Custom Animation Libraries
Svelte
Let's create
your visual story
Transform complex data into compelling narratives that drive strategic insights and decision making